fix(proxmox-cluster): dedupe 3x-scraped series, repair broken panels #287

Merged
k.renner merged 1 commits from claude-bot/dash-proxmox-cluster into master 2026-07-17 13:17:24 +00:00
Member

Proxmox VE Cluster — dashboard review & fix

Root cause (affects almost every panel)

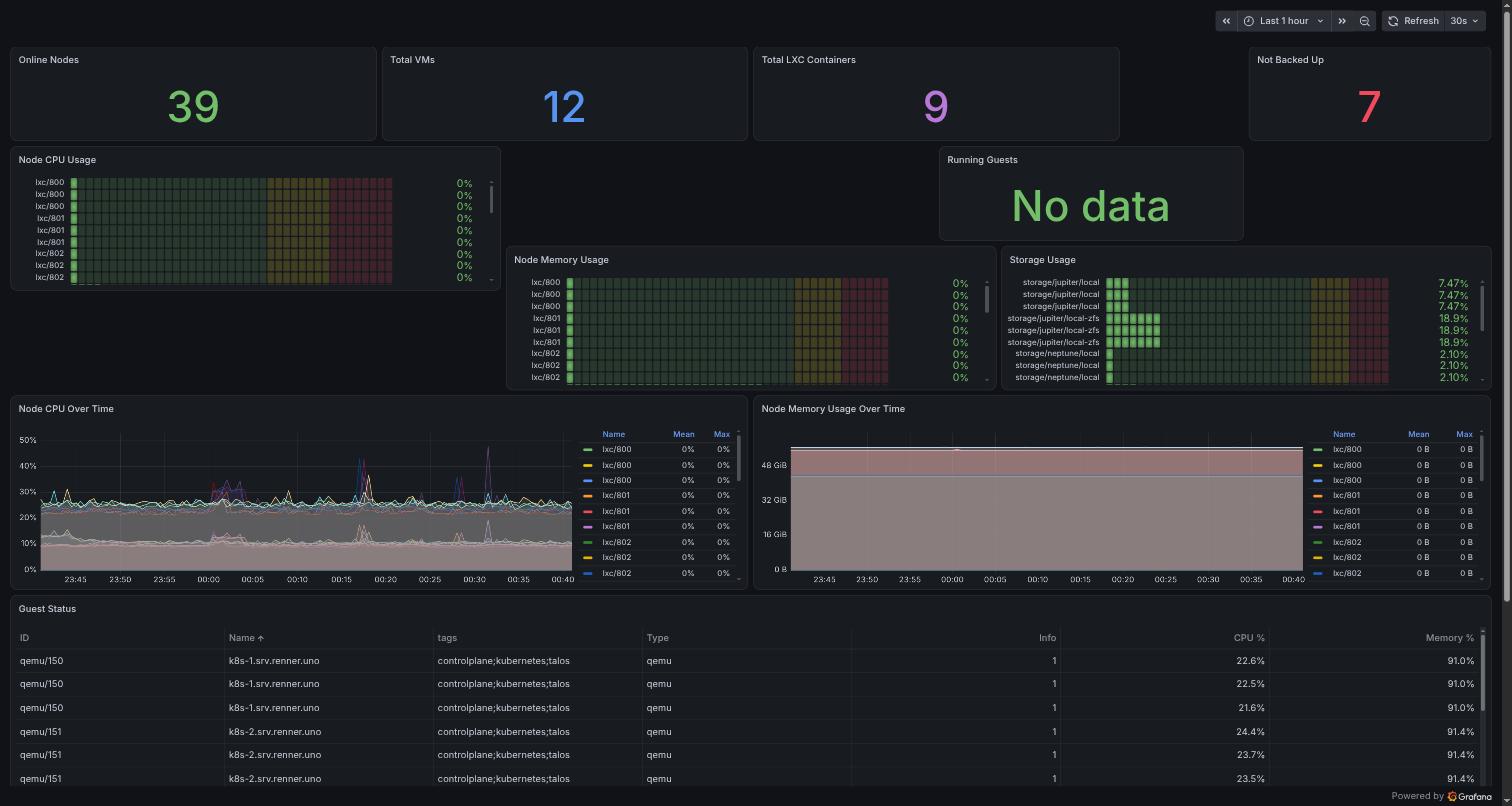
The pve Prometheus job scrapes the exporter via all 3 PVE node IPs (10.2.40.201/.202/.203), and each PVE node answers with the full cluster view. Every pve_* series therefore exists in triplicate (label instance differs). Nothing on this dashboard aggregated over that, so all counts were 3x too high and every bargauge/timeseries/table row appeared three times. All queries are now wrapped in max by (id) (...) / count(count by (id) (...)), which is robust even if one node stops answering.

Before

(top)
before-top

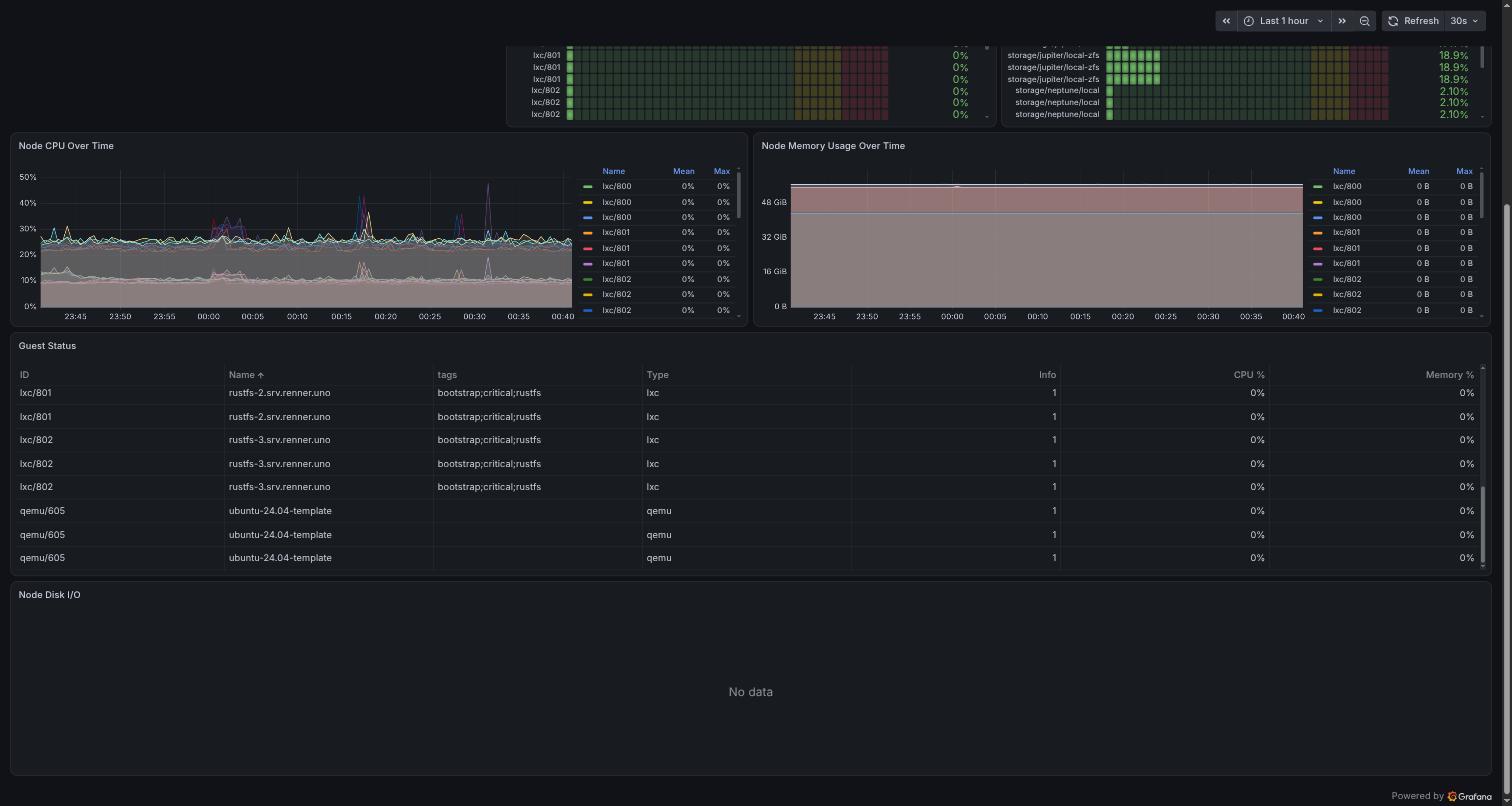
(bottom — note the triplicated table rows and the dead "Node Disk I/O" panel)
before-bottom

After

(top)
after-top

(bottom)
after-bottom

Findings

# Severity Finding Status
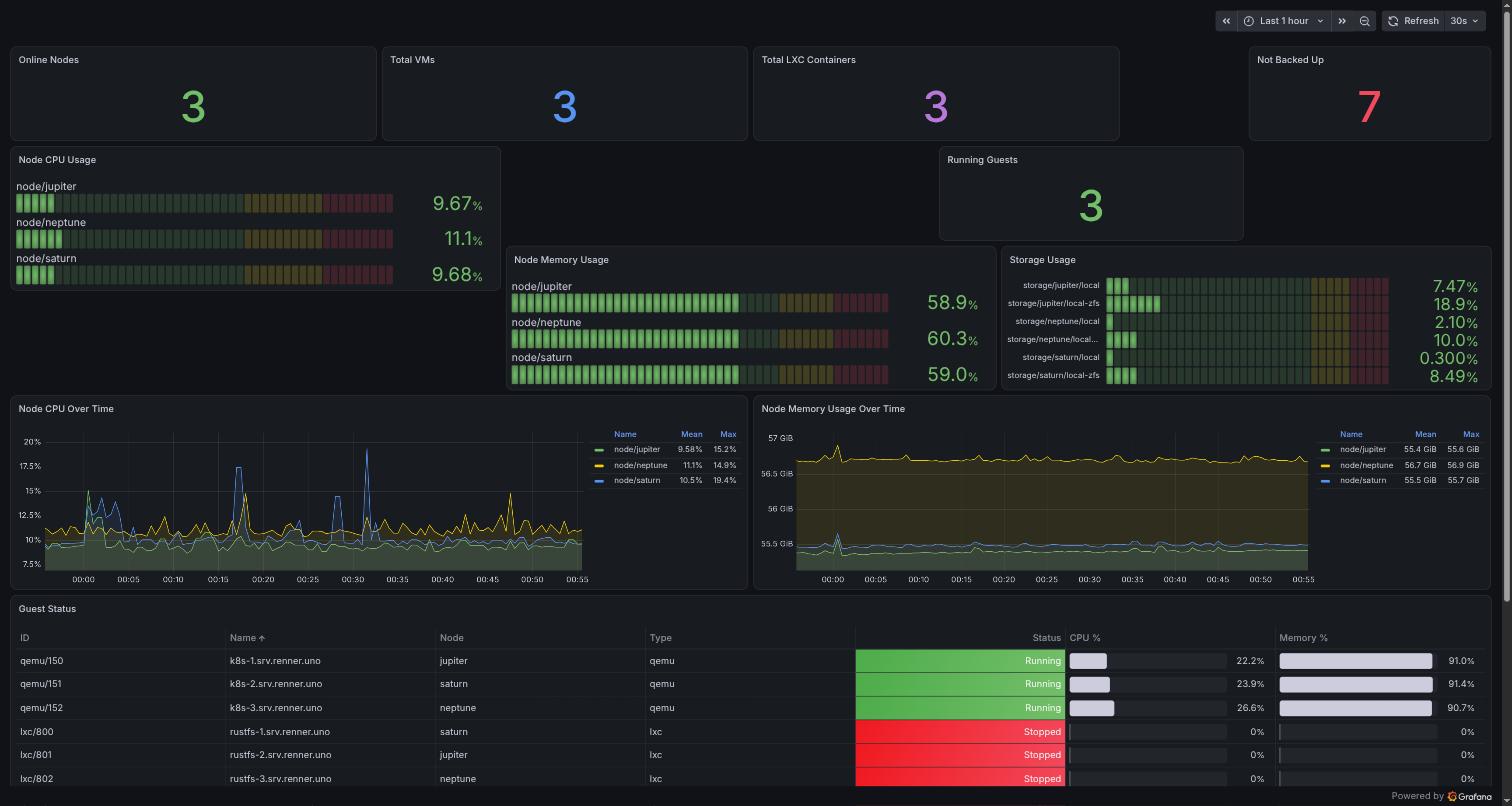
1 critical Online Nodes showed 39 (should be 3): count(pve_up == 1) counted cluster+nodes+guests+storages × 3 instances ✅ FIXED — count(count by (id) (pve_up{id=~"node/.*"} == 1)); threshold green at 3 so a lost node turns the stat red (mapping-based Up/Down coloring made no sense on a count and was removed)
2 critical Running Guests showed "No data": query filtered on pve_guest_info{status="running"}, but this pve-exporter version has no status label on pve_guest_info ✅ FIXED — derived from pve_up == 1 per guest id (for guests, pve_up = running). Verified: returns 3 (the k8s VMs; the rustfs LXCs are currently stopped, template never runs)
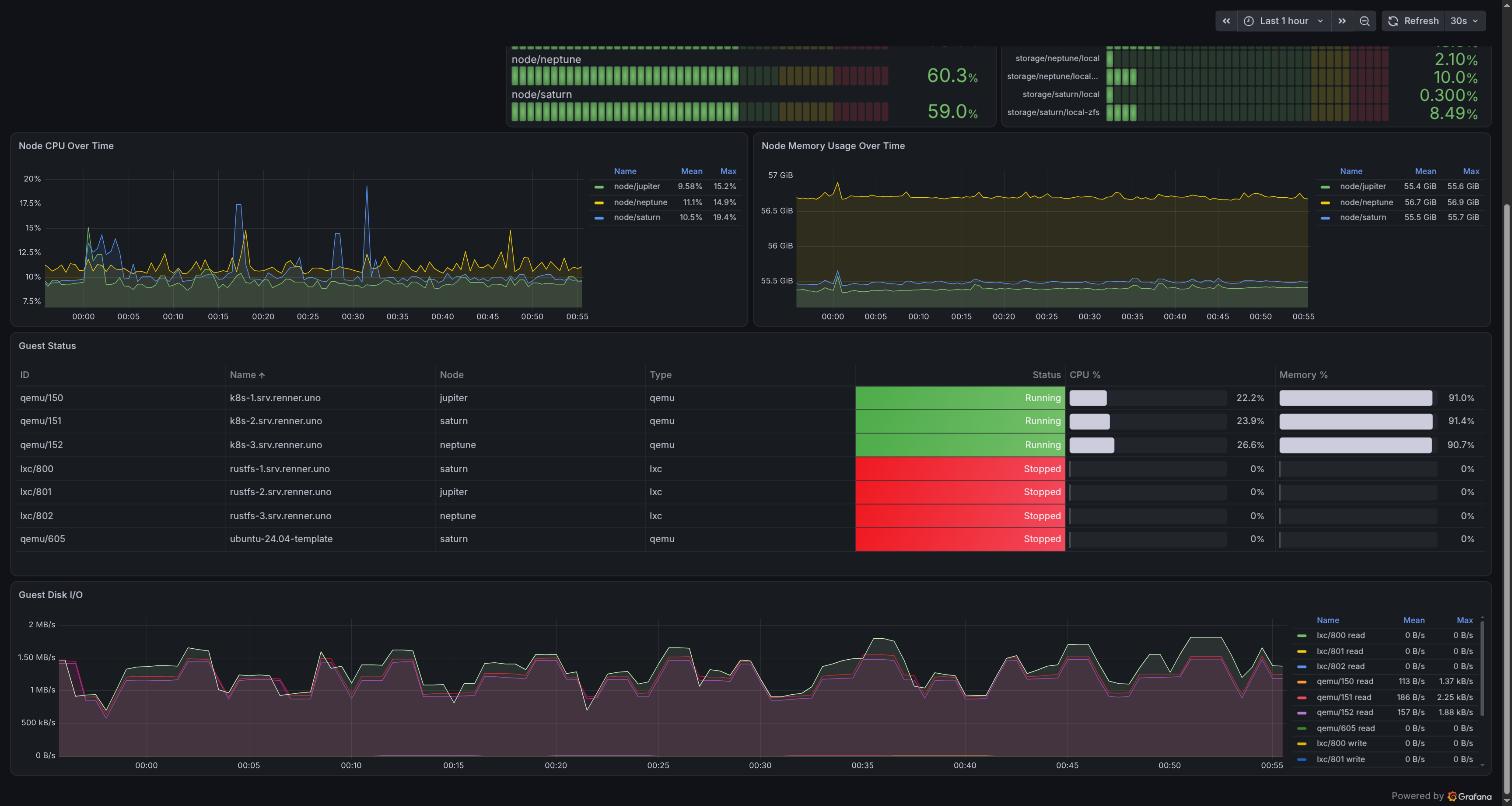
3 critical "Node Disk I/O" was permanently empty: pve_disk_read/write_bytes{id=~"node/.*"} — these metrics only exist for qemu/* and lxc/* ids, never for nodes (verified against live Prometheus) ✅ FIXED — repurposed as "Guest Disk I/O" using rate(pve_disk_read_bytes_total / pve_disk_written_bytes_total [5m]) per guest; shows real data (~1–2 MB/s on the k8s VMs)
4 major Total VMs showed 12 (4 qemu × 3 instances, incl. the ubuntu template) ✅ FIXED — unique ids, template="0" excluded → 3
5 major Total LXC showed 9 (3 × 3 instances) ✅ FIXED — unique ids → 3
6 major "Node CPU/Memory Usage" bargauges + both timeseries showed guests, not nodes (unfiltered pve_cpu_usage_ratio/pve_memory_usage_bytes matches qemu/lxc/nodes alike — the visible rows were all lxc/800..802 ×3) ✅ FIXED — filtered to id=~"node/.*" and deduped; panels now show exactly jupiter/saturn/neptune
7 major Guest Status table: 3 duplicate rows per guest, no Status column (same missing-label issue as #2), useless Info=1 and tags columns, and CPU%/Memory% cells rendered as plain text ✅ FIXED — all targets deduped via max by (id, ...), new Status target from pve_up (green Running / red Stopped), Info/tags dropped, column order ID→Name→Node→Type→Status→CPU%→Memory%
8 major Latent Grafana schema bug: the table used pre-Grafana-10 custom.displayMode while declaring schemaVersion: 38 — the v37 migration is skipped, so color-background and gradient-gauge were silently ignored (visible in the BEFORE shot) ✅ FIXED — migrated to custom.cellOptions
9 minor Storage Usage bargauge: triplicated rows ✅ FIXED — max by (id) on both sides of the division
10 info "Not Backed Up = 7" is CORRECT, not a bug — all 7 guests (3 VMs, 3 LXCs, 1 template) are not covered by any PVE backup job. Related: the pbs2 storage reports pve_up == 0 on all three nodes (inactive/unreachable) ⚠️ NOT FIXED — infrastructure finding, not a dashboard defect. Worth checking why pbs2 is down / whether vzdump jobs should exist
11 info rustfs LXCs 800/801/802 (tagged critical/bootstrap) are currently stopped ❓ QUESTION — intentional? The dashboard now shows this honestly; flagging since they carry a critical tag

Not touched

  • The retired HA VM (gone since 2026-05) no longer appears in any metric — no stale references found, nothing to clean up.
  • Scrape-side dedup (e.g. scraping only one PVE node) would fix the 3x duplication at the source, but scraping all 3 gives HA for the exporter path; the max by aggregation handles it correctly either way. Left as owner's call.

Verification

All fixed queries were verified against live Prometheus (port-forward) before applying:

  • pve_* metric inventory listed; pve_guest_info label set confirmed to have no status label (id, instance, job, name, node, tags, template, type)
  • count(count by (id) (pve_up{id=~"node/.*"} == 1)) → 3; Total VMs → 3; Total LXC → 3; Running Guests → 3
  • pve_disk_read_bytes{id=~"node/.*"} → no series (root cause of #3); guest rate(..._total[5m]) returns plausible values; pve_disk_read_bytes and pve_disk_read_bytes_total are value-identical aliases
  • Node memory % → 58.9/60.3/59.0; storage % matches BEFORE values (7.47/18.9/2.10/10.0/0.30/8.49)
  • AFTER screenshots taken from a temp preview (proxmox-cluster-preview), which was deleted afterwards

🤖 Generated with Claude Code

# Proxmox VE Cluster — dashboard review & fix ## Root cause (affects almost every panel) The `pve` Prometheus job scrapes the exporter via **all 3 PVE node IPs** (10.2.40.201/.202/.203), and each PVE node answers with the **full cluster view**. Every `pve_*` series therefore exists **in triplicate** (label `instance` differs). Nothing on this dashboard aggregated over that, so all counts were 3x too high and every bargauge/timeseries/table row appeared three times. All queries are now wrapped in `max by (id) (...)` / `count(count by (id) (...))`, which is robust even if one node stops answering. ## Before (top) ![before-top](https://gitea.renner.uno/attachments/69d65870-166f-415f-ab85-1fb663e036c4) (bottom — note the triplicated table rows and the dead "Node Disk I/O" panel) ![before-bottom](https://gitea.renner.uno/attachments/75ea1e15-12b7-47ed-a2a8-792e330900ec) ## After (top) ![after-top](https://gitea.renner.uno/attachments/802a053a-962a-469d-b420-1928b2897200) (bottom) ![after-bottom](https://gitea.renner.uno/attachments/a5f00058-6799-4e6e-beb0-60afe9ec2dc7) ## Findings | # | Severity | Finding | Status | |---|----------|---------|--------| | 1 | critical | **Online Nodes showed 39** (should be 3): `count(pve_up == 1)` counted cluster+nodes+guests+storages × 3 instances | ✅ FIXED — `count(count by (id) (pve_up{id=~"node/.*"} == 1))`; threshold green at 3 so a lost node turns the stat red (mapping-based Up/Down coloring made no sense on a count and was removed) | | 2 | critical | **Running Guests showed "No data"**: query filtered on `pve_guest_info{status="running"}`, but this pve-exporter version has **no `status` label** on `pve_guest_info` | ✅ FIXED — derived from `pve_up == 1` per guest id (for guests, `pve_up` = running). Verified: returns 3 (the k8s VMs; the rustfs LXCs are currently stopped, template never runs) | | 3 | critical | **"Node Disk I/O" was permanently empty**: `pve_disk_read/write_bytes{id=~"node/.*"}` — these metrics only exist for `qemu/*` and `lxc/*` ids, never for nodes (verified against live Prometheus) | ✅ FIXED — repurposed as **"Guest Disk I/O"** using `rate(pve_disk_read_bytes_total / pve_disk_written_bytes_total [5m])` per guest; shows real data (~1–2 MB/s on the k8s VMs) | | 4 | major | **Total VMs showed 12** (4 qemu × 3 instances, incl. the ubuntu template) | ✅ FIXED — unique ids, `template="0"` excluded → 3 | | 5 | major | **Total LXC showed 9** (3 × 3 instances) | ✅ FIXED — unique ids → 3 | | 6 | major | **"Node CPU/Memory Usage" bargauges + both timeseries showed guests, not nodes** (unfiltered `pve_cpu_usage_ratio`/`pve_memory_usage_bytes` matches qemu/lxc/nodes alike — the visible rows were all `lxc/800..802` ×3) | ✅ FIXED — filtered to `id=~"node/.*"` and deduped; panels now show exactly jupiter/saturn/neptune | | 7 | major | **Guest Status table**: 3 duplicate rows per guest, no Status column (same missing-label issue as #2), useless `Info`=1 and `tags` columns, and CPU%/Memory% cells rendered as plain text | ✅ FIXED — all targets deduped via `max by (id, ...)`, new Status target from `pve_up` (green Running / red Stopped), Info/tags dropped, column order ID→Name→Node→Type→Status→CPU%→Memory% | | 8 | major | **Latent Grafana schema bug**: the table used pre-Grafana-10 `custom.displayMode` while declaring `schemaVersion: 38` — the v37 migration is skipped, so `color-background` and `gradient-gauge` were **silently ignored** (visible in the BEFORE shot) | ✅ FIXED — migrated to `custom.cellOptions` | | 9 | minor | Storage Usage bargauge: triplicated rows | ✅ FIXED — `max by (id)` on both sides of the division | | 10 | info | **"Not Backed Up = 7" is CORRECT, not a bug** — all 7 guests (3 VMs, 3 LXCs, 1 template) are not covered by any PVE backup job. Related: the `pbs2` storage reports `pve_up == 0` on all three nodes (inactive/unreachable) | ⚠️ NOT FIXED — infrastructure finding, not a dashboard defect. Worth checking why pbs2 is down / whether vzdump jobs should exist | | 11 | info | rustfs LXCs 800/801/802 (tagged `critical`/`bootstrap`) are currently **stopped** | ❓ QUESTION — intentional? The dashboard now shows this honestly; flagging since they carry a `critical` tag | ## Not touched - The retired HA VM (gone since 2026-05) no longer appears in any metric — no stale references found, nothing to clean up. - Scrape-side dedup (e.g. scraping only one PVE node) would fix the 3x duplication at the source, but scraping all 3 gives HA for the exporter path; the `max by` aggregation handles it correctly either way. Left as owner's call. ## Verification All fixed queries were verified against live Prometheus (port-forward) before applying: - `pve_*` metric inventory listed; `pve_guest_info` label set confirmed to have **no `status` label** (id, instance, job, name, node, tags, template, type) - `count(count by (id) (pve_up{id=~"node/.*"} == 1))` → 3; Total VMs → 3; Total LXC → 3; Running Guests → 3 - `pve_disk_read_bytes{id=~"node/.*"}` → **no series** (root cause of #3); guest `rate(..._total[5m])` returns plausible values; `pve_disk_read_bytes` and `pve_disk_read_bytes_total` are value-identical aliases - Node memory % → 58.9/60.3/59.0; storage % matches BEFORE values (7.47/18.9/2.10/10.0/0.30/8.49) - AFTER screenshots taken from a temp preview (`proxmox-cluster-preview`), which was deleted afterwards 🤖 Generated with [Claude Code](https://claude.com/claude-code)
claude-bot added 1 commit 2026-07-16 23:06:50 +00:00
The pve-exporter is scraped via all 3 PVE nodes and each scrape returns the
full cluster view, so every series exists in triplicate. All stat counts were
3x too high (Online Nodes showed 39 instead of 3) and every bargauge/table
row appeared three times. Wrap all queries in max by (id) / count by (id).

- Online Nodes: count unique node/* ids with pve_up==1 (was 39, now 3);
  threshold green at 3 so a lost node turns red
- Total VMs: count unique qemu guests excluding templates (was 12, now 3)
- Total LXC: count unique ids (was 9, now 3)
- Running Guests: pve_guest_info has no status label in this exporter
  version (panel showed No data); derive from pve_up==1 per guest instead
- Node CPU/Memory bargauges + timeseries: filter to id=~"node/.*" — they
  showed every guest (mostly lxc rows), not nodes
- Guest Status table: dedupe rows, add Status column from pve_up (color
  mapped 1=Running/0=Stopped), drop useless Info column, migrate
  custom.displayMode -> custom.cellOptions (schemaVersion 38 skips the
  Grafana 10 migration, so gradient gauges/color background were silently
  ignored)
- Node Disk I/O -> Guest Disk I/O: pve_disk_read/write metrics only exist
  for qemu/lxc guests, never node/* (panel was permanently No data); use
  the *_total counters with rate()

Co-Authored-By: Claude Opus 4.8 <noreply@anthropic.com>
k.renner merged commit fa1b526fe4 into master 2026-07-17 13:17:24 +00:00
Sign in to join this conversation.