Dashboard uid home-energy. All queries are InfluxDB/Flux (bucket suedstr28) — the Prometheus double-counting lead from home-overview does not apply here: the stat/graph panels use smart_meter_sum_active_instantaneous_power for the total and smart_meter_l[123]_… for the phases separately, so there was no phase+total summing bug. The real problems were different: three panels were permanently dead (one from an invalid-regex compile error, two from filters that match nothing), and the "Top 20 devices" list was neither top-N nor devices.
Before
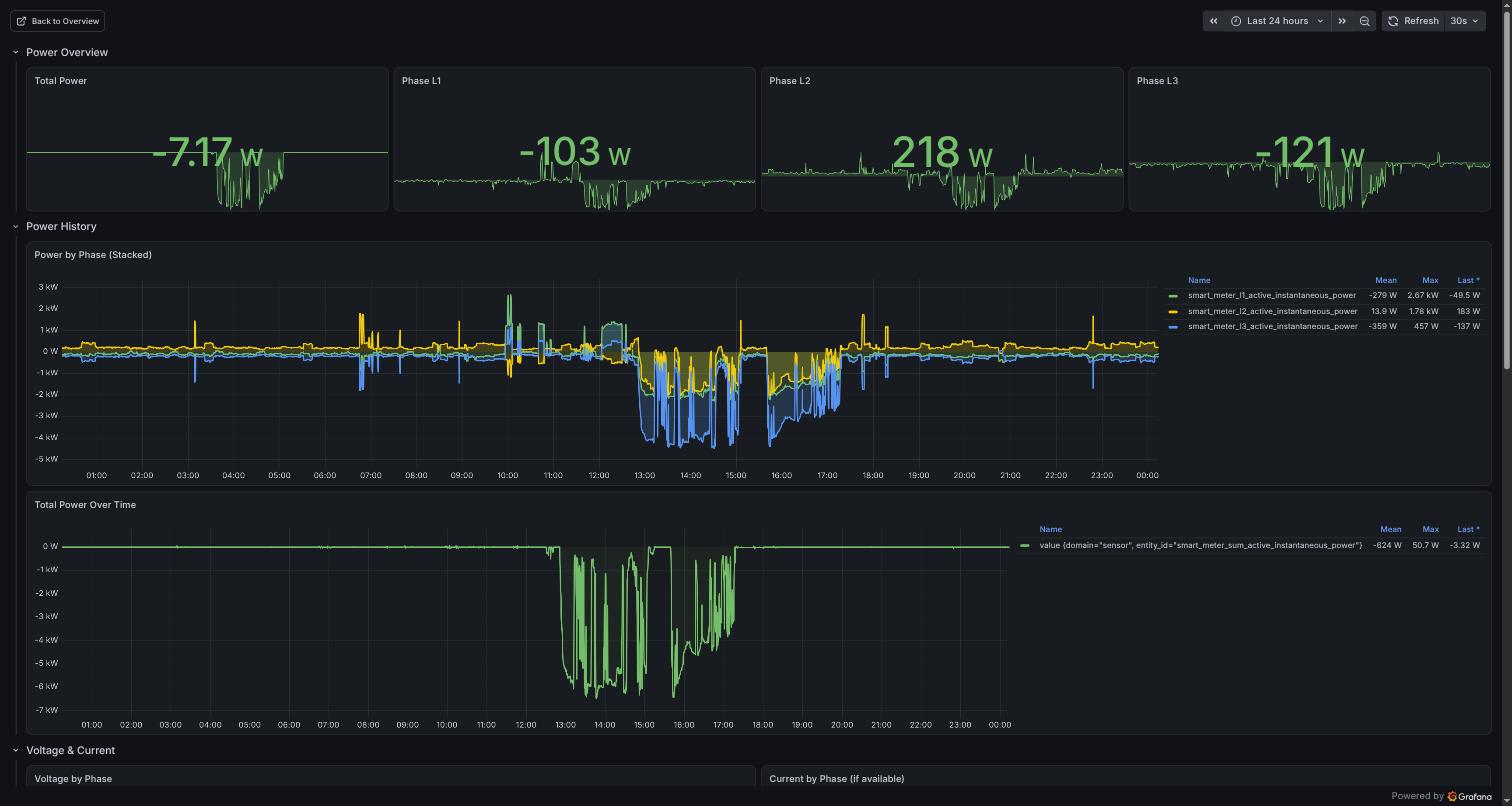
Top (stat panels + phase graph — note stacked mixed-sign phases and raw entity-id legends):
Middle (Current by Phase: No data; legend cut off):
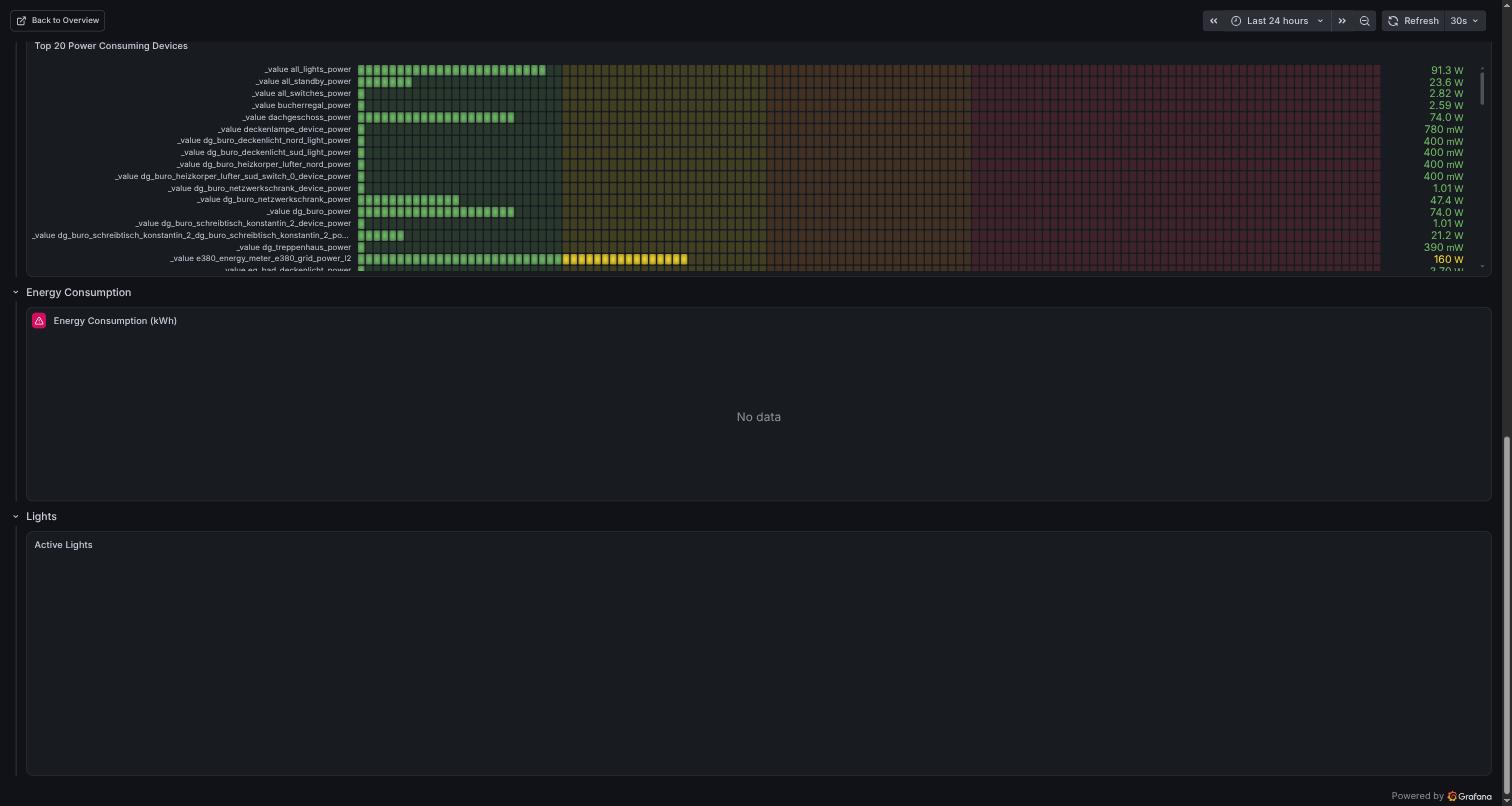
Bottom (Top-20 unsorted with _value labels and aggregates; Energy Consumption: No data; Active Lights: empty):
After
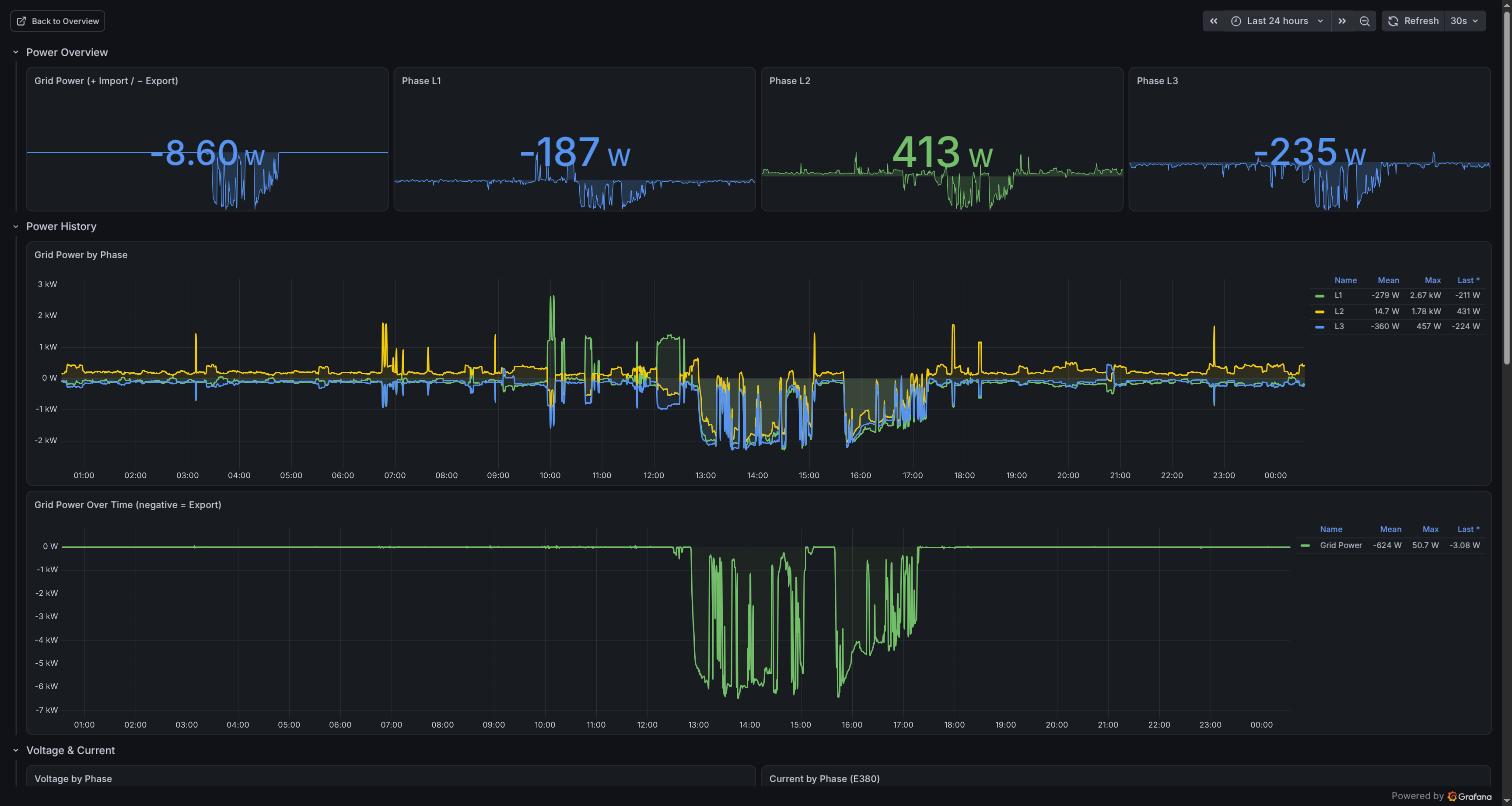
Top (grid semantics explicit, export shown blue, unstacked L1/L2/L3):
Middle (Current by Phase now live from E380; full legends — Top-20 still loading in this shot):
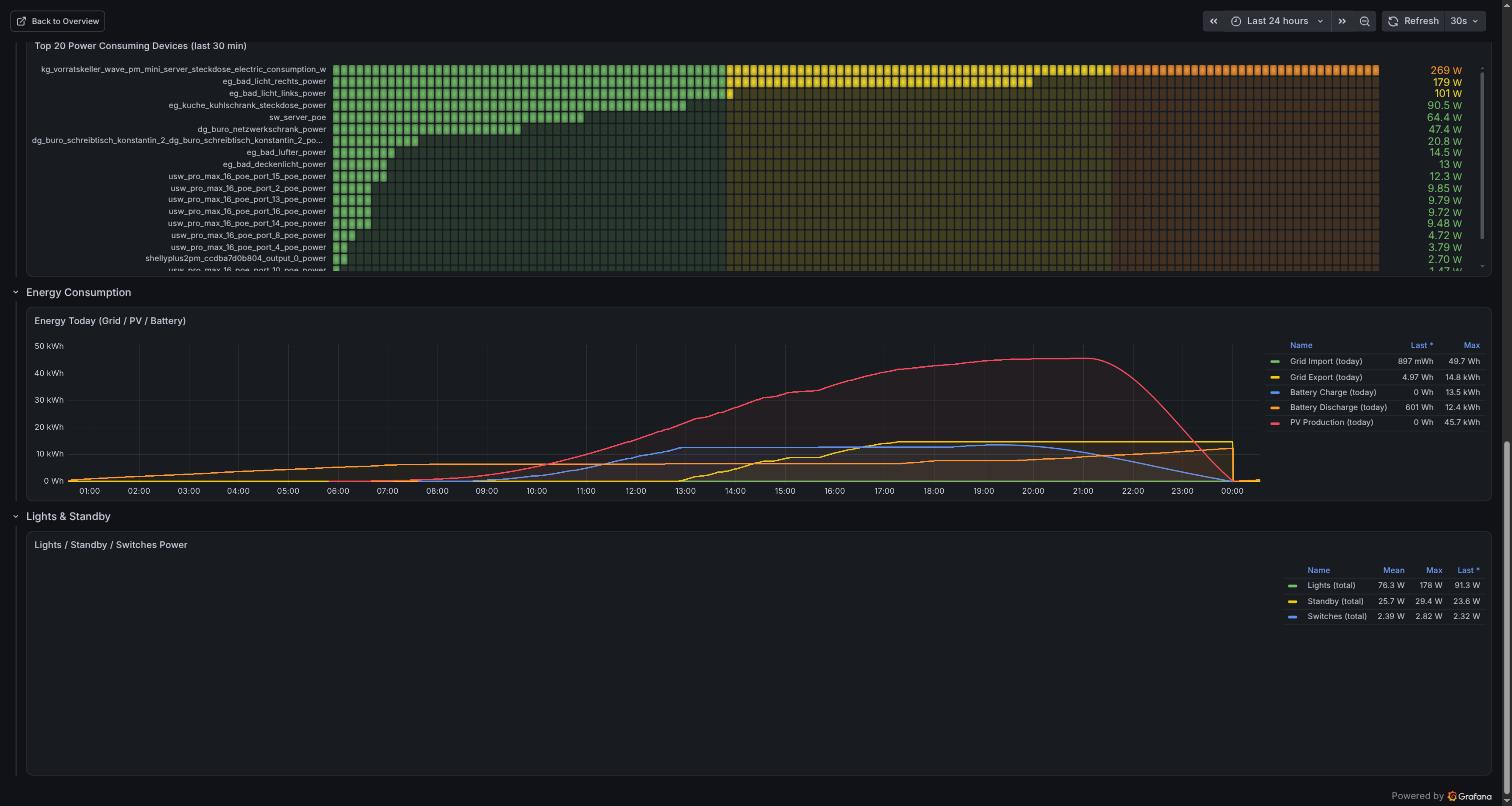
Bottom (real sorted Top-20 with clean labels; Energy Today with daily counters incl. midnight reset; Lights/Standby/Switches panel — chart was still rendering in this shot, verified drawn right after):
Review report
Critical
"Current by Phase (if available)" was permanently empty.
Query filtered r.entity_id =~ /smart_meter.*current/ — the smart meter exposes no current entities at all (verified via HA /api/states and Influx schema.tagValues). The only per-phase current series in the bucket are e380_energy_meter_e380_current_l[123] (fresh data, verified). ✅ FIXED — switched to the E380 currents, short L1/L2/L3 legend names, spanNulls: true because these sensors update sparsely (change-based).
"Energy Consumption (kWh)" was permanently dead — root cause CORRECTED after review feedback. First analysis claimed the bucket has no kWh measurement — that was wrong, a false negative from a truncated schema.measurements() listing (it caps at 1001 entries; kWh sorts past the cutoff). The kWh measurement exists and has plenty of data. Real root cause, proven by running the original query verbatim: the regex /(energy|verbrauch)/i is invalid Flux syntax — Flux/Go regex has no /…/i flag (case-insensitivity is (?i) inline). The query fails to compile: HTTP 400, invalid: error @1:221-1:222: undefined identifier i. The panel never executed a query at all (that is the error triangle in the before shot). The same query with the flag removed returns 140 series. ✅ FIXED — replaced with the verified Wh daily counters: strom_bezug_tag, strom_einspeisung_tag, vitocharge_vx3_vx3_pv_production_today, …battery_charge_today, …battery_discharge_today, with readable display names. Sanity-checked yesterday's maxima: PV 44.6 kWh, export 13.9 kWh, import 3.2 kWh, battery 13.2/10.0 kWh — plausible summer day, so the Wh scale is right. Why not simply fix the regex flag? The 140 matching kWh series are lifetime cumulative counters of wildly different magnitudes (checked live: all_switches_energy 4.6 kWh … one floor counter at 75 461 kWh) — plotting raw lifetime totals on one axis is unreadable and answers no question. The daily counters directly answer "how much energy today". ❓ QUESTION — if you'd like a per-floor/per-room daily consumption panel on top, the powercalc kWh counters (dachgeschoss_energy, erdgeschoss_energy, dg_buro_energy, …) support that via difference()/windowed spread — say the word and I'll add it.
"Active Lights" was permanently empty.
Query filtered r.domain == "light" and r._measurement == "%". Re-verified by direct probe (not a truncated listing) after the kWh lesson: range(start: -30d) |> filter(domain=="light" and _measurement=="%") |> group() |> count() returns zero rows, and known dimmable light entity IDs (eg_kuche_ambiente, signe_gradient_floor_1, …) also have zero rows under % over 30 days. Light entities are recorded under per-entity measurements (light.<entity_id>), not under %. ✅ FIXED — replaced the dead table with a Lights / Standby / Switches power timeseries from the verified powercalc aggregates all_lights_power / all_standby_power / all_switches_power (energy-relevant and alive). ❓ QUESTION — if you'd rather have a per-light brightness table here, it needs a different data path (the %-measurement approach can't work); happy to build an alternative if you tell me what you want to see.
Major
"Top 20 Power Consuming Devices" was not top-20, not sorted, and not devices.
Flux sort+limit ran per-table (one table per series), so the panel showed all ~150 W-series alphabetically, not the top 20 by value.
The only exclusion was /phase/, so the list mixed in the grid meter itself (smart_meter_sum…, e380_…grid_power_l2), PV/battery/inverter series, Solcast forecasts, heat-pump thermal output, and powercalc room/floor/house aggregates (all_lights_power, dachgeschoss_power, eg_kuche_power, …) — i.e. massive double counting between groups and their members.
range(v.timeRangeStart) |> last() meant dead sensors kept showing stale values.
Labels rendered as _value all_lights_power. ✅ FIXED — group() before global sort/limit (now a real top-20); curated exclusion filters for grid/PV/battery/forecast/thermal/aggregate/_device_power-twin series; fixed fresh range(start: -30m) so only currently-reporting devices appear; rowsToFields transformation for clean labels; removed the hard max: 500 clamp. ⚠️ NOT FIXED (by design) — the panel now ignores the dashboard time picker (fixed 30-min window). For a "current draw" ranking that's the honest behavior; say the word if you want it range-driven instead.
Minor / UX
Grid semantics were hidden. "Total Power" showed −7 W (and the graph −7 kW midday) with consumption-only green/yellow/red thresholds — negative means PV export, which the panel pretended not to know. ✅ FIXED — retitled to "Grid Power (+ Import / − Export)" / "Grid Power Over Time (negative = Export)", blue color step for negative (export) on all four stat panels.
"Power by Phase (Stacked)" stacked mixed-sign series — stacking positive and negative phase values on top of each other produces a visually meaningless chart. ✅ FIXED — unstacked, and legend names shortened from smart_meter_l1_active_instantaneous_power to L1/L2/L3 (also on the voltage panel; the sum panel now says "Grid Power" instead of value {domain="sensor", entity_id="…"}).
Voltage/current legend tables were cut off (3 series + header in an h=8 panel). ✅ FIXED — both panels h=8→9, rows below shifted by 1.
Verification
smart_meter_* power/voltage entities: confirmed live via HA /api/states (sum −8 W, phases ±, voltages ~233 V).
Original energy query run verbatim against live InfluxDB: HTTP 400 Flux compile error (undefined identifier i) — the /…/i regex flag is invalid Flux. Without the flag: 140 series. (Earlier claim "no kWh measurement" was wrong — schema.measurements() truncates at 1001 entries; absence must be proven by direct query, not by listing.)
schema.tagValues for measurement A listed e380_energy_meter_e380_current_l[123]; additionally verified by direct query returning fresh data points within the last hours.
Old lights query verified dead by direct 30-day probe: count() over domain=="light" and _measurement=="%" → zero rows (and zero rows for known dimmable entity IDs under %).
Daily energy counters: HA reports unit Wh; yesterday's maxima (PV 44 554 Wh, export 13 893 Wh, import 3 180 Wh) confirm true Wh scale post-open3e-migration. Note: history from before the 2026-07 ViCare→open3e migration may be on a different scale in these series; within the default 24 h window this is not an issue.
New Top-20 query executed against live InfluxDB before committing: returns 15 real devices at ~01:00 (night), correctly sorted (server plug 300 W → PoE switch 66 W → network rack 48 W → …), no aggregates, no grid/PV series.
AFTER screenshots rendered from a temp preview (home-energy-preview), which was deleted afterwards.
# Home Energy Details — review & fixes
Dashboard uid `home-energy`. All queries are InfluxDB/Flux (bucket `suedstr28`) — the Prometheus double-counting lead from home-overview does **not** apply here: the stat/graph panels use `smart_meter_sum_active_instantaneous_power` for the total and `smart_meter_l[123]_…` for the phases separately, so there was no phase+total summing bug. The real problems were different: three panels were permanently dead (one from an invalid-regex compile error, two from filters that match nothing), and the "Top 20 devices" list was neither top-N nor devices.
## Before
Top (stat panels + phase graph — note stacked mixed-sign phases and raw entity-id legends):

Middle (Current by Phase: **No data**; legend cut off):

Bottom (Top-20 unsorted with `_value` labels and aggregates; Energy Consumption: **No data**; Active Lights: empty):

## After
Top (grid semantics explicit, export shown blue, unstacked L1/L2/L3):

Middle (Current by Phase now live from E380; full legends — Top-20 still loading in this shot):

Bottom (real sorted Top-20 with clean labels; Energy Today with daily counters incl. midnight reset; Lights/Standby/Switches panel — chart was still rendering in this shot, verified drawn right after):

## Review report
### Critical
1. **"Current by Phase (if available)" was permanently empty.**
Query filtered `r.entity_id =~ /smart_meter.*current/` — the smart meter exposes **no** current entities at all (verified via HA `/api/states` and Influx `schema.tagValues`). The only per-phase current series in the bucket are `e380_energy_meter_e380_current_l[123]` (fresh data, verified).
✅ FIXED — switched to the E380 currents, short L1/L2/L3 legend names, `spanNulls: true` because these sensors update sparsely (change-based).
2. **"Energy Consumption (kWh)" was permanently dead — root cause CORRECTED after review feedback.**
~~First analysis claimed the bucket has no `kWh` measurement~~ — that was **wrong**, a false negative from a truncated `schema.measurements()` listing (it caps at 1001 entries; `kWh` sorts past the cutoff). The `kWh` measurement exists and has plenty of data.
**Real root cause, proven by running the original query verbatim:** the regex `/(energy|verbrauch)/i` is **invalid Flux syntax** — Flux/Go regex has no `/…/i` flag (case-insensitivity is `(?i)` inline). The query fails to compile: HTTP 400, `invalid: error @1:221-1:222: undefined identifier i`. The panel never executed a query at all (that is the error triangle in the before shot). The same query with the flag removed returns 140 series.
✅ FIXED — replaced with the verified `Wh` daily counters: `strom_bezug_tag`, `strom_einspeisung_tag`, `vitocharge_vx3_vx3_pv_production_today`, `…battery_charge_today`, `…battery_discharge_today`, with readable display names. Sanity-checked yesterday's maxima: PV 44.6 kWh, export 13.9 kWh, import 3.2 kWh, battery 13.2/10.0 kWh — plausible summer day, so the Wh scale is right.
**Why not simply fix the regex flag?** The 140 matching `kWh` series are lifetime cumulative counters of wildly different magnitudes (checked live: `all_switches_energy` 4.6 kWh … one floor counter at 75 461 kWh) — plotting raw lifetime totals on one axis is unreadable and answers no question. The daily counters directly answer "how much energy today". ❓ QUESTION — if you'd like a per-floor/per-room daily consumption panel on top, the powercalc `kWh` counters (`dachgeschoss_energy`, `erdgeschoss_energy`, `dg_buro_energy`, …) support that via `difference()`/windowed spread — say the word and I'll add it.
3. **"Active Lights" was permanently empty.**
Query filtered `r.domain == "light" and r._measurement == "%"`. Re-verified by **direct probe** (not a truncated listing) after the kWh lesson: `range(start: -30d) |> filter(domain=="light" and _measurement=="%") |> group() |> count()` returns **zero rows**, and known dimmable light entity IDs (`eg_kuche_ambiente`, `signe_gradient_floor_1`, …) also have zero rows under `%` over 30 days. Light entities are recorded under per-entity measurements (`light.<entity_id>`), not under `%`.
✅ FIXED — replaced the dead table with a Lights / Standby / Switches power timeseries from the verified powercalc aggregates `all_lights_power` / `all_standby_power` / `all_switches_power` (energy-relevant and alive). ❓ QUESTION — if you'd rather have a per-light brightness table here, it needs a different data path (the `%`-measurement approach can't work); happy to build an alternative if you tell me what you want to see.
### Major
4. **"Top 20 Power Consuming Devices" was not top-20, not sorted, and not devices.**
- Flux `sort`+`limit` ran per-table (one table per series), so the panel showed **all** ~150 W-series alphabetically, not the top 20 by value.
- The only exclusion was `/phase/`, so the list mixed in the grid meter itself (`smart_meter_sum…`, `e380_…grid_power_l2`), PV/battery/inverter series, Solcast **forecasts**, heat-pump **thermal** output, and powercalc room/floor/house aggregates (`all_lights_power`, `dachgeschoss_power`, `eg_kuche_power`, …) — i.e. massive double counting between groups and their members.
- `range(v.timeRangeStart) |> last()` meant dead sensors kept showing stale values.
- Labels rendered as `_value all_lights_power`.
✅ FIXED — `group()` before global sort/limit (now a real top-20); curated exclusion filters for grid/PV/battery/forecast/thermal/aggregate/`_device_power`-twin series; fixed fresh `range(start: -30m)` so only currently-reporting devices appear; `rowsToFields` transformation for clean labels; removed the hard `max: 500` clamp.
⚠️ NOT FIXED (by design) — the panel now ignores the dashboard time picker (fixed 30-min window). For a "current draw" ranking that's the honest behavior; say the word if you want it range-driven instead.
### Minor / UX
5. **Grid semantics were hidden.** "Total Power" showed −7 W (and the graph −7 kW midday) with consumption-only green/yellow/red thresholds — negative means PV export, which the panel pretended not to know.
✅ FIXED — retitled to "Grid Power (+ Import / − Export)" / "Grid Power Over Time (negative = Export)", blue color step for negative (export) on all four stat panels.
6. **"Power by Phase (Stacked)" stacked mixed-sign series** — stacking positive and negative phase values on top of each other produces a visually meaningless chart.
✅ FIXED — unstacked, and legend names shortened from `smart_meter_l1_active_instantaneous_power` to `L1/L2/L3` (also on the voltage panel; the sum panel now says "Grid Power" instead of `value {domain="sensor", entity_id="…"}`).
7. **Voltage/current legend tables were cut off** (3 series + header in an h=8 panel).
✅ FIXED — both panels h=8→9, rows below shifted by 1.
## Verification
- `smart_meter_*` power/voltage entities: confirmed live via HA `/api/states` (sum −8 W, phases ±, voltages ~233 V).
- Original energy query run verbatim against live InfluxDB: HTTP 400 Flux compile error (`undefined identifier i`) — the `/…/i` regex flag is invalid Flux. Without the flag: 140 series. (Earlier claim "no kWh measurement" was wrong — `schema.measurements()` truncates at 1001 entries; absence must be proven by direct query, not by listing.)
- `schema.tagValues` for measurement `A` listed `e380_energy_meter_e380_current_l[123]`; additionally verified by direct query returning fresh data points within the last hours.
- Old lights query verified dead by direct 30-day probe: `count()` over `domain=="light" and _measurement=="%"` → zero rows (and zero rows for known dimmable entity IDs under `%`).
- Daily energy counters: HA reports unit `Wh`; yesterday's maxima (PV 44 554 Wh, export 13 893 Wh, import 3 180 Wh) confirm true Wh scale post-open3e-migration. Note: history from before the 2026-07 ViCare→open3e migration may be on a different scale in these series; within the default 24 h window this is not an issue.
- New Top-20 query executed against live InfluxDB before committing: returns 15 real devices at ~01:00 (night), correctly sorted (server plug 300 W → PoE switch 66 W → network rack 48 W → …), no aggregates, no grid/PV series.
- AFTER screenshots rendered from a temp preview (`home-energy-preview`), which was deleted afterwards.
- Current by Phase: regex /smart_meter.*current/ matched nothing (smart
meter exposes no current entities) -> use verified
e380_energy_meter_e380_current_l[123]; spanNulls for sparse updates
- Energy Consumption: measurement "kWh" does not exist in the bucket
-> plot verified Wh daily counters (grid import/export, PV production,
battery charge/discharge) with readable display names
- Active Lights: light-domain data is never recorded under measurement
"%" -> replace dead table with Lights/Standby/Switches power
timeseries from verified powercalc aggregates (all_*_power)
- Top 20 Devices: add group() so sort/limit work globally (was
alphabetical, unsorted, per-table); exclude grid meters, PV/battery,
forecasts, powercalc room/floor aggregates and _device_power twins;
fresh 30-min window instead of stale last() over the full range;
rowsToFields for clean labels (was "_value xyz_power")
- Grid semantics: retitle Total Power -> Grid Power (+Import/-Export),
blue threshold for export; unstack mixed-sign phase graph; short
L1/L2/L3 legend names; taller voltage/current panels so the legend
table is not cut off
Co-Authored-By: Claude Opus 4.8 <noreply@anthropic.com>
Correction to the review report (PR body updated in place).
My original claim that the suedstr28 bucket has no kWh measurement was false — a false negative from schema.measurements(), which truncates at 1001 entries so kWh looked absent. Re-verified by direct queries:
Original "Energy Consumption (kWh)" query run verbatim → HTTP 400 Flux compile error: undefined identifier i. The real root cause is the regex /(energy|verbrauch)/i — Flux has no /…/i flag (case-insensitivity is (?i) inline). The panel never executed a query; that's the error triangle in the before shot.
Same query with the flag removed → 140 series. kWh exists and is well populated.
"Active Lights" claim re-verified by direct probe instead of a listing: 30-day count() over domain=="light" and _measurement=="%" → zero rows (also zero for known dimmable entity IDs). That finding stands.
Panel decision unchanged, reason corrected: the 140 matching kWh series are lifetime cumulative counters spanning 4.6 kWh to 75 461 kWh — plotting raw lifetime totals on one axis is unreadable, so the daily counters (strom_bezug_tag, strom_einspeisung_tag, PV/battery *_today) remain the better panel. If you want per-floor daily consumption from the powercalc kWh counters (dachgeschoss_energy etc. via difference()), I'll add it.
No dashboard JSON changed in this correction, so the AFTER screenshots are still accurate.
**Correction to the review report (PR body updated in place).**
My original claim that the `suedstr28` bucket has no `kWh` measurement was **false** — a false negative from `schema.measurements()`, which truncates at 1001 entries so `kWh` looked absent. Re-verified by direct queries:
1. Original "Energy Consumption (kWh)" query run **verbatim** → HTTP 400 Flux compile error: `undefined identifier i`. The real root cause is the regex `/(energy|verbrauch)/i` — Flux has no `/…/i` flag (case-insensitivity is `(?i)` inline). The panel never executed a query; that's the error triangle in the before shot.
2. Same query with the flag removed → **140 series**. `kWh` exists and is well populated.
3. "Active Lights" claim re-verified by direct probe instead of a listing: 30-day `count()` over `domain=="light" and _measurement=="%"` → **zero rows** (also zero for known dimmable entity IDs). That finding stands.
**Panel decision unchanged, reason corrected:** the 140 matching `kWh` series are lifetime cumulative counters spanning 4.6 kWh to 75 461 kWh — plotting raw lifetime totals on one axis is unreadable, so the daily counters (`strom_bezug_tag`, `strom_einspeisung_tag`, PV/battery `*_today`) remain the better panel. If you want per-floor daily consumption from the powercalc `kWh` counters (`dachgeschoss_energy` etc. via `difference()`), I'll add it.
No dashboard JSON changed in this correction, so the AFTER screenshots are still accurate.
Blocking a user prevents them from interacting with repositories, such as opening or commenting on pull requests or issues. Learn more about blocking a user.
Home Energy Details — review & fixes
Dashboard uid
home-energy. All queries are InfluxDB/Flux (bucketsuedstr28) — the Prometheus double-counting lead from home-overview does not apply here: the stat/graph panels usesmart_meter_sum_active_instantaneous_powerfor the total andsmart_meter_l[123]_…for the phases separately, so there was no phase+total summing bug. The real problems were different: three panels were permanently dead (one from an invalid-regex compile error, two from filters that match nothing), and the "Top 20 devices" list was neither top-N nor devices.Before
Top (stat panels + phase graph — note stacked mixed-sign phases and raw entity-id legends):
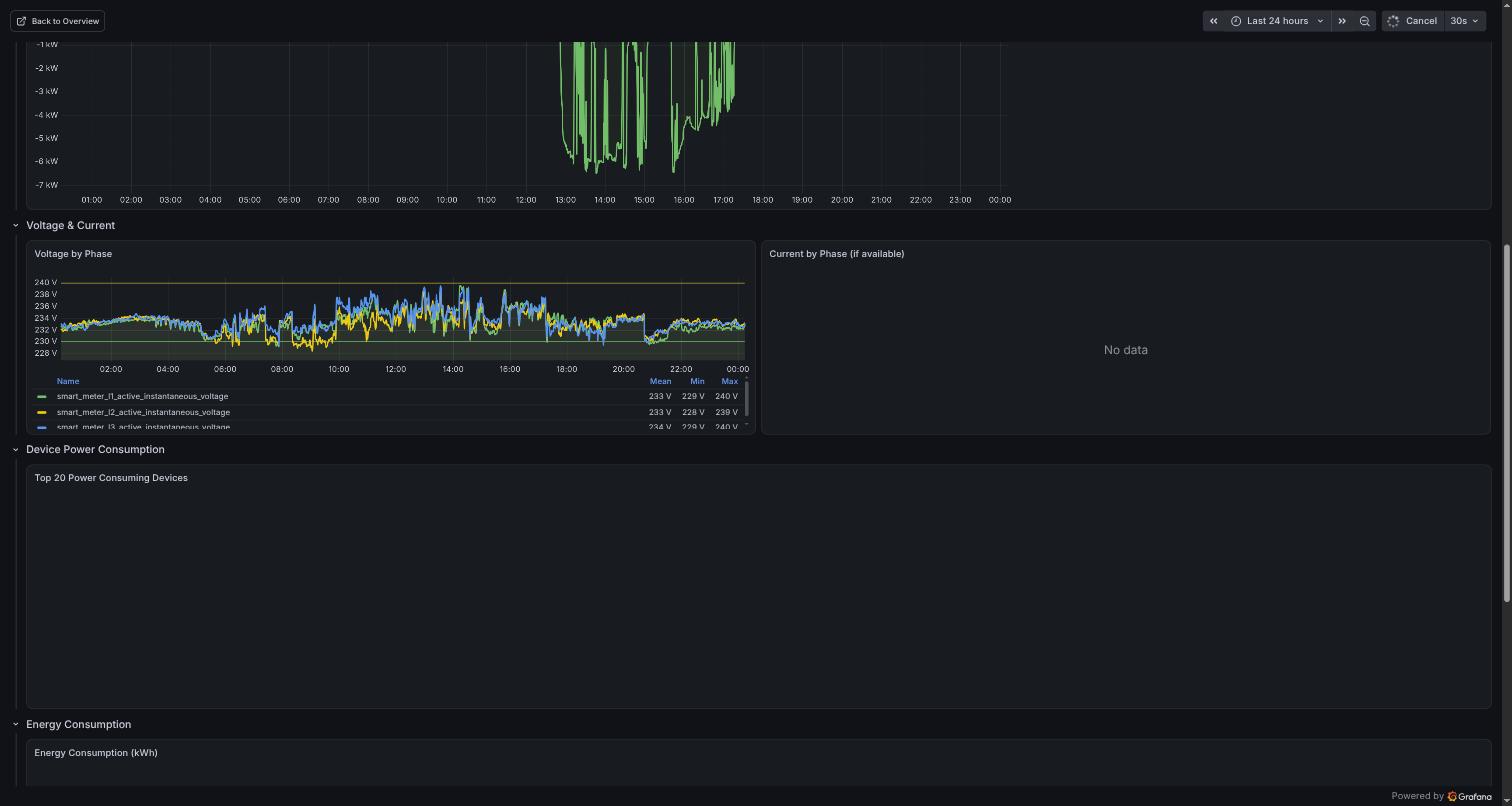
Middle (Current by Phase: No data; legend cut off):
Bottom (Top-20 unsorted with
_valuelabels and aggregates; Energy Consumption: No data; Active Lights: empty):After
Top (grid semantics explicit, export shown blue, unstacked L1/L2/L3):
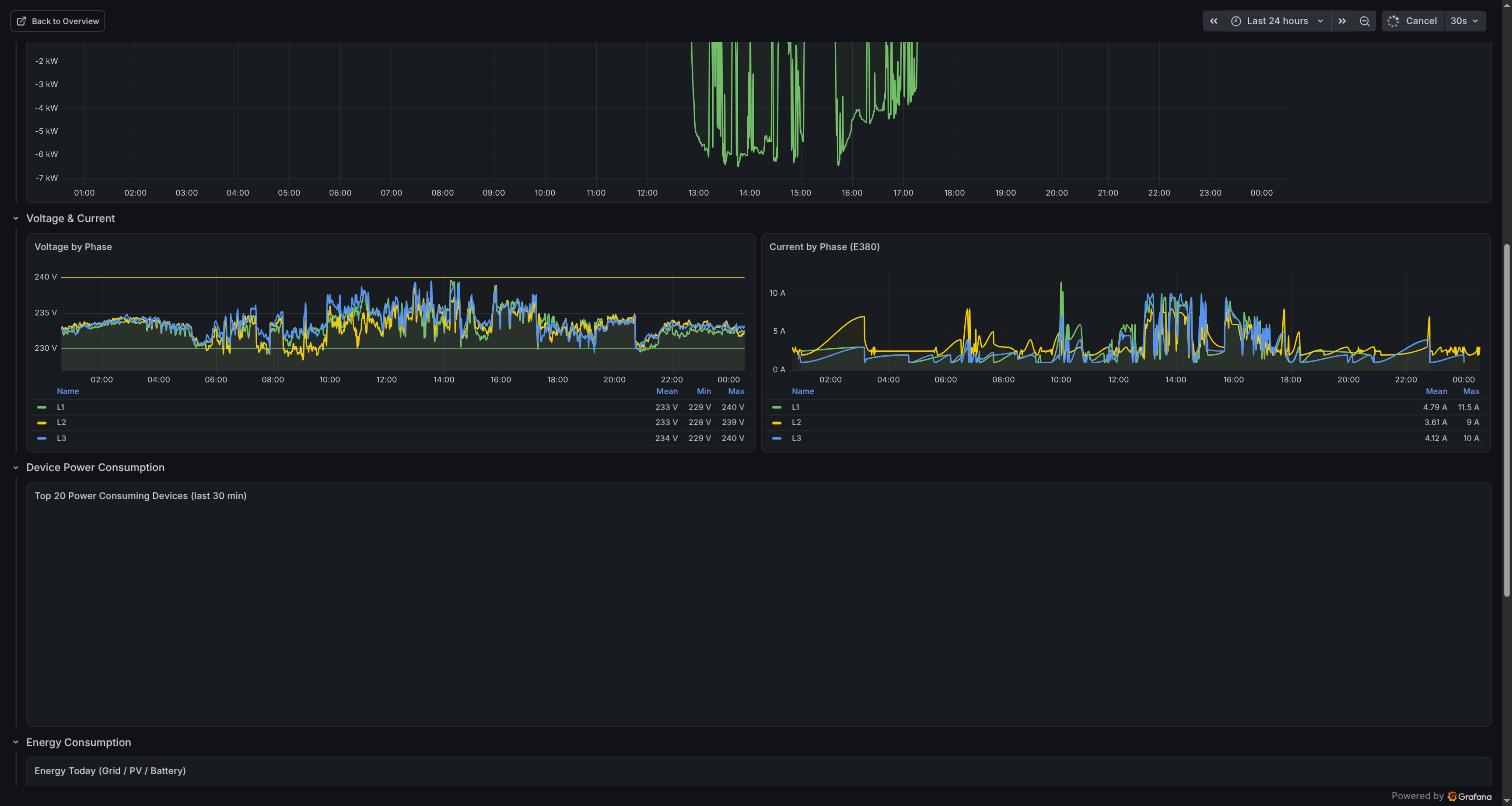
Middle (Current by Phase now live from E380; full legends — Top-20 still loading in this shot):
Bottom (real sorted Top-20 with clean labels; Energy Today with daily counters incl. midnight reset; Lights/Standby/Switches panel — chart was still rendering in this shot, verified drawn right after):
Review report
Critical
"Current by Phase (if available)" was permanently empty.
Query filtered
r.entity_id =~ /smart_meter.*current/— the smart meter exposes no current entities at all (verified via HA/api/statesand Influxschema.tagValues). The only per-phase current series in the bucket aree380_energy_meter_e380_current_l[123](fresh data, verified).✅ FIXED — switched to the E380 currents, short L1/L2/L3 legend names,
spanNulls: truebecause these sensors update sparsely (change-based)."Energy Consumption (kWh)" was permanently dead — root cause CORRECTED after review feedback.
First analysis claimed the bucket has no— that was wrong, a false negative from a truncatedkWhmeasurementschema.measurements()listing (it caps at 1001 entries;kWhsorts past the cutoff). ThekWhmeasurement exists and has plenty of data.Real root cause, proven by running the original query verbatim: the regex
/(energy|verbrauch)/iis invalid Flux syntax — Flux/Go regex has no/…/iflag (case-insensitivity is(?i)inline). The query fails to compile: HTTP 400,invalid: error @1:221-1:222: undefined identifier i. The panel never executed a query at all (that is the error triangle in the before shot). The same query with the flag removed returns 140 series.✅ FIXED — replaced with the verified
Whdaily counters:strom_bezug_tag,strom_einspeisung_tag,vitocharge_vx3_vx3_pv_production_today,…battery_charge_today,…battery_discharge_today, with readable display names. Sanity-checked yesterday's maxima: PV 44.6 kWh, export 13.9 kWh, import 3.2 kWh, battery 13.2/10.0 kWh — plausible summer day, so the Wh scale is right.Why not simply fix the regex flag? The 140 matching
kWhseries are lifetime cumulative counters of wildly different magnitudes (checked live:all_switches_energy4.6 kWh … one floor counter at 75 461 kWh) — plotting raw lifetime totals on one axis is unreadable and answers no question. The daily counters directly answer "how much energy today". ❓ QUESTION — if you'd like a per-floor/per-room daily consumption panel on top, the powercalckWhcounters (dachgeschoss_energy,erdgeschoss_energy,dg_buro_energy, …) support that viadifference()/windowed spread — say the word and I'll add it."Active Lights" was permanently empty.
Query filtered
r.domain == "light" and r._measurement == "%". Re-verified by direct probe (not a truncated listing) after the kWh lesson:range(start: -30d) |> filter(domain=="light" and _measurement=="%") |> group() |> count()returns zero rows, and known dimmable light entity IDs (eg_kuche_ambiente,signe_gradient_floor_1, …) also have zero rows under%over 30 days. Light entities are recorded under per-entity measurements (light.<entity_id>), not under%.✅ FIXED — replaced the dead table with a Lights / Standby / Switches power timeseries from the verified powercalc aggregates
all_lights_power/all_standby_power/all_switches_power(energy-relevant and alive). ❓ QUESTION — if you'd rather have a per-light brightness table here, it needs a different data path (the%-measurement approach can't work); happy to build an alternative if you tell me what you want to see.Major
sort+limitran per-table (one table per series), so the panel showed all ~150 W-series alphabetically, not the top 20 by value./phase/, so the list mixed in the grid meter itself (smart_meter_sum…,e380_…grid_power_l2), PV/battery/inverter series, Solcast forecasts, heat-pump thermal output, and powercalc room/floor/house aggregates (all_lights_power,dachgeschoss_power,eg_kuche_power, …) — i.e. massive double counting between groups and their members.range(v.timeRangeStart) |> last()meant dead sensors kept showing stale values._value all_lights_power.✅ FIXED —
group()before global sort/limit (now a real top-20); curated exclusion filters for grid/PV/battery/forecast/thermal/aggregate/_device_power-twin series; fixed freshrange(start: -30m)so only currently-reporting devices appear;rowsToFieldstransformation for clean labels; removed the hardmax: 500clamp.⚠️ NOT FIXED (by design) — the panel now ignores the dashboard time picker (fixed 30-min window). For a "current draw" ranking that's the honest behavior; say the word if you want it range-driven instead.
Minor / UX
Grid semantics were hidden. "Total Power" showed −7 W (and the graph −7 kW midday) with consumption-only green/yellow/red thresholds — negative means PV export, which the panel pretended not to know.
✅ FIXED — retitled to "Grid Power (+ Import / − Export)" / "Grid Power Over Time (negative = Export)", blue color step for negative (export) on all four stat panels.
"Power by Phase (Stacked)" stacked mixed-sign series — stacking positive and negative phase values on top of each other produces a visually meaningless chart.
✅ FIXED — unstacked, and legend names shortened from
smart_meter_l1_active_instantaneous_powertoL1/L2/L3(also on the voltage panel; the sum panel now says "Grid Power" instead ofvalue {domain="sensor", entity_id="…"}).Voltage/current legend tables were cut off (3 series + header in an h=8 panel).
✅ FIXED — both panels h=8→9, rows below shifted by 1.
Verification
smart_meter_*power/voltage entities: confirmed live via HA/api/states(sum −8 W, phases ±, voltages ~233 V).undefined identifier i) — the/…/iregex flag is invalid Flux. Without the flag: 140 series. (Earlier claim "no kWh measurement" was wrong —schema.measurements()truncates at 1001 entries; absence must be proven by direct query, not by listing.)schema.tagValuesfor measurementAlistede380_energy_meter_e380_current_l[123]; additionally verified by direct query returning fresh data points within the last hours.count()overdomain=="light" and _measurement=="%"→ zero rows (and zero rows for known dimmable entity IDs under%).Wh; yesterday's maxima (PV 44 554 Wh, export 13 893 Wh, import 3 180 Wh) confirm true Wh scale post-open3e-migration. Note: history from before the 2026-07 ViCare→open3e migration may be on a different scale in these series; within the default 24 h window this is not an issue.home-energy-preview), which was deleted afterwards.Correction to the review report (PR body updated in place).
My original claim that the
suedstr28bucket has nokWhmeasurement was false — a false negative fromschema.measurements(), which truncates at 1001 entries sokWhlooked absent. Re-verified by direct queries:undefined identifier i. The real root cause is the regex/(energy|verbrauch)/i— Flux has no/…/iflag (case-insensitivity is(?i)inline). The panel never executed a query; that's the error triangle in the before shot.kWhexists and is well populated.count()overdomain=="light" and _measurement=="%"→ zero rows (also zero for known dimmable entity IDs). That finding stands.Panel decision unchanged, reason corrected: the 140 matching
kWhseries are lifetime cumulative counters spanning 4.6 kWh to 75 461 kWh — plotting raw lifetime totals on one axis is unreadable, so the daily counters (strom_bezug_tag,strom_einspeisung_tag, PV/battery*_today) remain the better panel. If you want per-floor daily consumption from the powercalckWhcounters (dachgeschoss_energyetc. viadifference()), I'll add it.No dashboard JSON changed in this correction, so the AFTER screenshots are still accurate.