fix(homeassistant-overview): repair dead panels, curate sensors, honest stats #279

Merged
k.renner merged 1 commits from claude-bot/dash-homeassistant-overview into master 2026-07-17 10:59:09 +00:00
Member

Dashboard review: homeassistant-overview ("Home Assistant Overview")

Full review against live Prometheus/HA data, with surgical fixes. Three panels were completely dead, several others showed misleading or unreadable data.

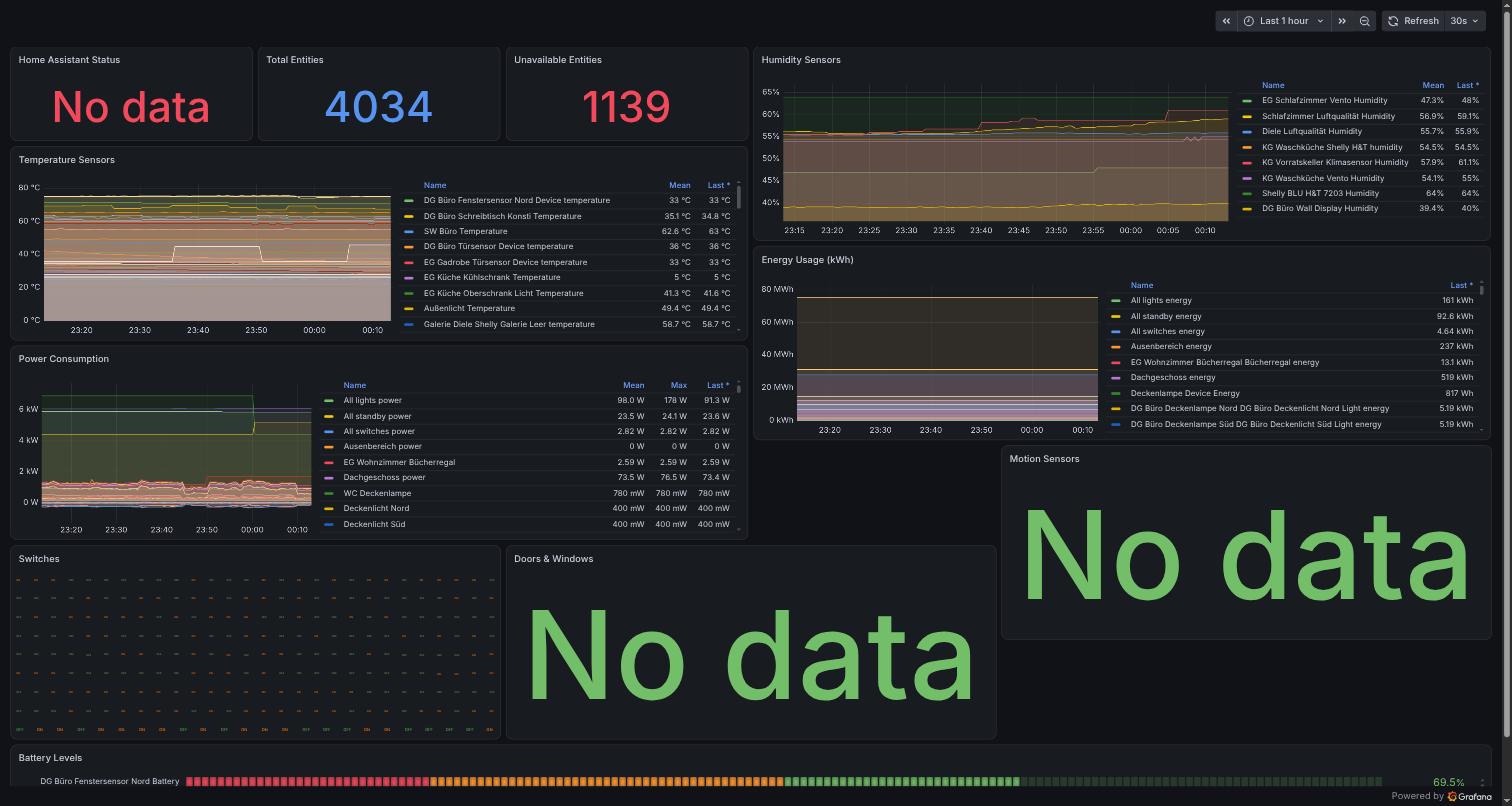
Before

Dead Status / Doors & Windows / Motion panels, device temps as "room" temps, 6 kW forecast spike in Power, 80 MWh axis in Energy, 248-tile Switches wall, crushed battery row, layout hole:
before

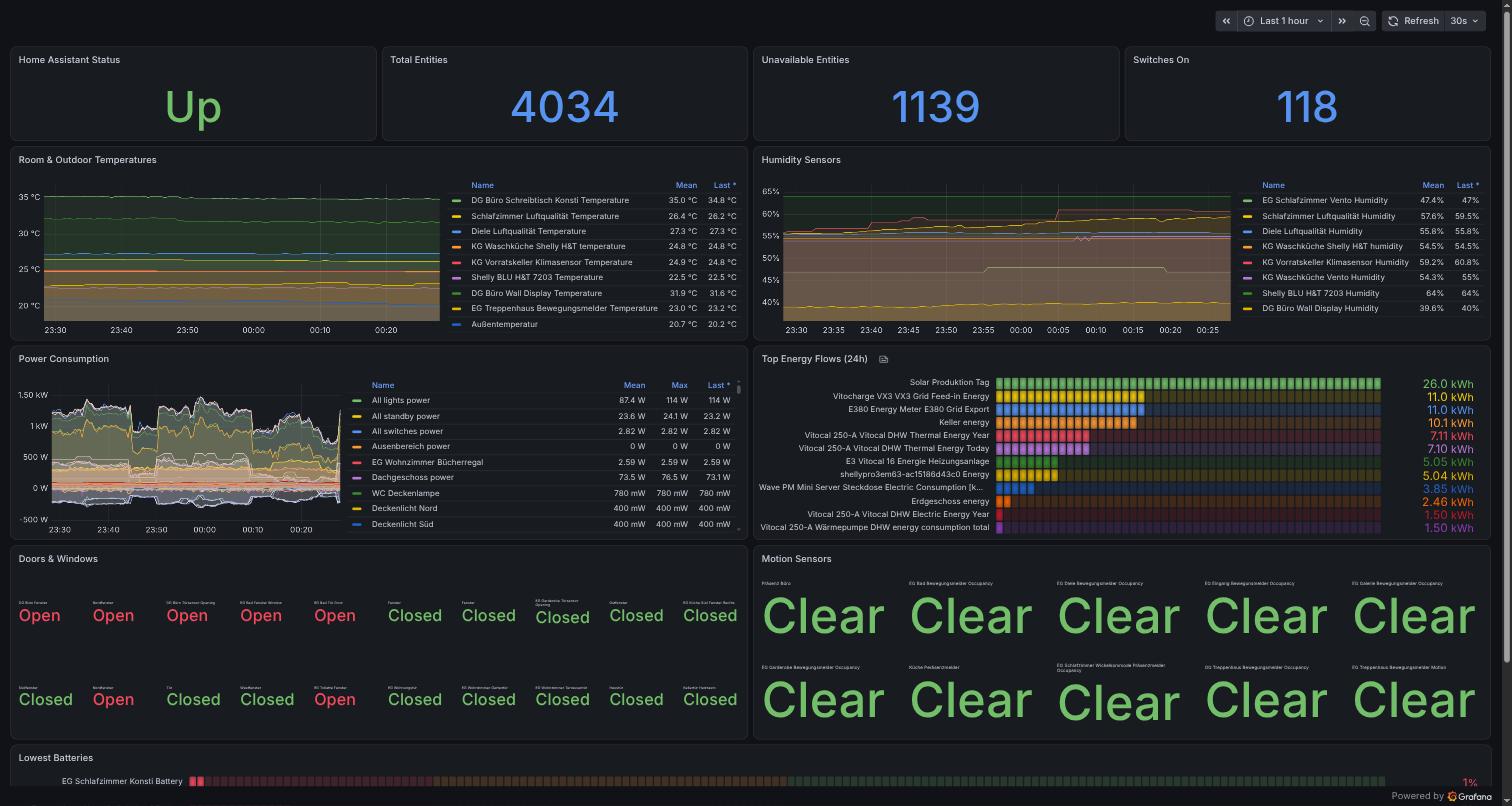
After

Top (all stats live, curated room temps, honest power, top energy flows):
after

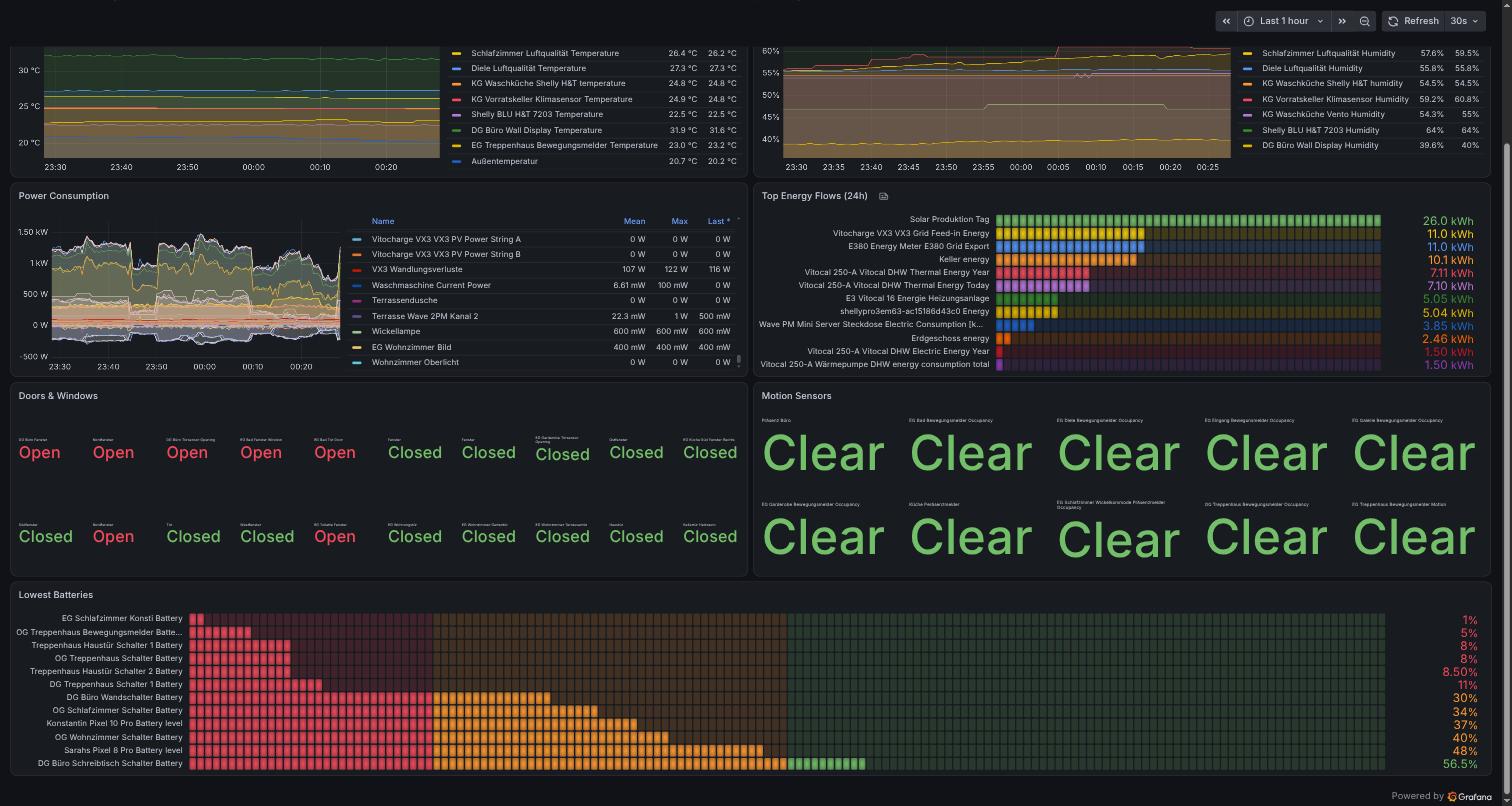
Bottom (curated door/motion tiles, lowest-12 batteries sorted and twin-free):
after-bottom

Review report

Critical

  1. "Home Assistant Status" showed No data. Query used up{job="homeassistant"} but the scrape job is named home-assistant (with hyphen).
    ✅ FIXED — corrected job label; verified against live Prometheus (exactly one series, the proxy :8124 target, post duplicate-scrape fix).

  2. "Doors & Windows" showed No data. Query filtered on device_class=~"door|window|opening", but the HA Prometheus exporter emits no device_class label at all (only entity, friendly_name, domain).
    ✅ FIXED — curated entity list built from HA's own device_class registry (via template API): exactly one canonical is-open entity per physical contact (22 sensors). The HmIP contacts export 12+ entities per device (*_open, *_window_door_is_open, *_is_open_2, *_is_closed, tilt, intrusion, …) — only the canonical *_open entity is used, so no inverted semantics and no _2 twins. Appliance contacts (fridge door, Wickelschublade) deliberately excluded.

  3. "Motion Sensors" showed No data. Same missing-label cause (device_class="motion").
    ✅ FIXED — curated regex over the physical Bewegungsmelder/Präsenzmelder (including the bewegunsmelder typo entity), excluding per-zone twins (*_zone_N_occupancy) and synthetic magic_areas_* entities. 10 sensors currently report.

Major

  1. "Temperature Sensors" mixed room temps with device electronics temps. All 61 temperature series were plotted: fridge (5 °C), PoE switches (59–75 °C), Shelly relay internals (56–76 °C), Zigbee coordinator chips, NAS drives, heat-pump internals — drowning the ~9 real room sensors.
    ✅ FIXED — panel is now "Room & Outdoor Temperatures" with a curated include list (verified sensor by sensor): DG Büro desk + wall display, EG Schlafzimmer/Diele Luftqualität, EG Treppenhaus, KG Waschküche/Vorratskeller/KG Schlafzimmer, plus Außentemperatur (Vitocal outdoor sensor). The three dead EG Shelly H&T sensors (eg_bad_shellyht, eg_schlafzimmer_shelly_h_t, eg_wohnzimmer_shellyht — dead batteries) are included in the regex so they reappear automatically once revived.

  2. "Power Consumption" plotted non-consumption series. The 6 kW "spike" in the before shot is Vitocharge battery max charge power — a constant capability value, not a measurement. Solcast peak forecasts (5.2/4.4 kW) and power_production_next_12hours were also drawn as if real draw.
    ✅ FIXED — excluded forecast/capability/derived series (solcast_*, power_production_*, *_max_(charge|discharge)_power, erlaubte_*, hauslast_nacht*). Top series are now real measurements (battery ~955 W, Gesamtverbrauch ~953 W, inverter AC ~846 W — verified live).

  3. "Energy Usage (kWh)" plotted raw lifetime counters. Axis ran to 80 MWh because multi-year cumulative counters were mixed with small daily sensors — the panel conveyed nothing.
    ✅ FIXED — replaced with "Top Energy Flows (24h)": bargauge of topk(12, max by (entity, friendly_name) (increase(...[24h]))), forecast counters excluded (solcast_*, forecast.solar's energy_production_* / energy_current_hour / energy_next_hour). The max by also dedupes duplicate-scrape residue still inside the 24 h lookback (observed pairs like 4310.2/4309.0 during verification; self-heals, dedup keeps it honest meanwhile). Current output: Solar Produktion Tag 26 kWh, grid export 11 kWh, Keller 10.1 kWh, DHW thermal 7.1 kWh — all plausible.

  4. "Switches" was a wall of 248 unreadable micro-tiles.
    ✅ FIXED — replaced by a "Switches On" count stat in the top row (currently 118 of 248). A per-switch view is unusable at this cardinality and most entries are config/diagnostic switches.

  5. "Battery Levels" crammed 119 bars into one 4-unit row, with battery_notes twins. Every device appeared twice (*_battery + *_battery_plus), pairs like 1 %/1 %.
    ✅ FIXED — now "Lowest Batteries": bottomk(12, ...) excluding *battery_plus* twins, instant query, double height. Renders 1 % → 56.5 % sorted, twin-free.

Minor

  1. Entity-count stats could double-count under scrape faults.
    ✅ FIXED — both counts wrapped in count(max by (entity) (...)); all stat panels switched to instant: true so a dead exporter shows No data instead of a stale last value.

  2. "Unavailable Entities" thresholds were meaningless. Yellow at ≥1, red at ≥5 — but the structural baseline is ~1139 unavailable of 4034 (cross-checked against the HA API: 1138 unavailable/unknown at review time — disabled integrations, dead sensors, _2 twins). The panel was permanently red while nothing was wrong.
    ✅ FIXED — neutral blue display; it is an informational count, not an alert.

  3. Ragged layout. The 3-stat top row spanned only half the width, so Grafana float-packed the right column up 4 rows, leaving a hole next to "Motion Sensors".
    ✅ FIXED — clean 4-stat top row (Status, Total, Unavailable, Switches On), aligned 2×2 chart grid, full-width battery row.

Hardware findings (plain, not papered over)

  • ⚠️ 5 motion sensors are unavailable in HA right now: g5_dome_motion, g6_instant_motion (UniFi cameras), haustur_entry_motion, dg_treppenhaus_bewegungsmelder_motion, kg_werkstatt_prasenzmelder_occupancy. They are in the panel regex and will appear when they come back — hardware/integration issue, not a dashboard one.
  • ⚠️ dg_buro_fenstersensor_sud_opening (DG Büro south window) is not reporting; the other 21 curated contacts are live.
  • ⚠️ DG Büro Meter Pro (SwitchBot, known offline) currently has no temperature entity in HA at all, so it could not be added to the temperature list without guessing an entity id. Can be appended once it returns.

Open questions

  • ❓ Obergeschoss has no room temperature sensor (expected per your earlier confirmation), so the temperature panel has no OG series. Fine as-is, or do you want an explicit "Kein Sensor installiert" placeholder like on home-overview?
  • ❓ "Power Consumption" still plots ~170 individual series (honest data now, but an unwieldy legend). Keep, or cut down to house total + PV + battery + top consumers? I'll push either variant.

Verification

Every query was verified against live Prometheus (instant queries via port-forward) and the HA REST/template API before being written:

  • up{job="home-assistant"} → 1 series, value 1; job="homeassistant" → empty (root cause #1).
  • homeassistant_binary_sensor_state label set contains no device_class (root cause #2/#3); curated lists derived from HA's device_class registry via the template API.
  • Entity counts: raw count(...) == deduped count(max by (entity)(...)) == 4034 (no active double-count); unavailable 1139 vs HA API 1138 ✓.
  • Curated doors list: 21/22 live; motion list: 10 live (5 unavailable, listed above); typo entity eg_eingang_bewegunsmelder_occupancy confirmed matched by bewegun.?smelder.
  • Power/energy exclusions: confirmed the surviving top series are genuine measurements (values quoted above); confirmed battery_max_charge_power, Solcast peaks and PV Vorhersage counters are gone.
  • Battery bottomk output verified twin-free and ascending.
  • JSON validated (json.load); modified dashboard rendered via temp preview uid homeassistant-overview-preview (deleted after the after-shots).
# Dashboard review: homeassistant-overview ("Home Assistant Overview") Full review against live Prometheus/HA data, with surgical fixes. Three panels were completely dead, several others showed misleading or unreadable data. ## Before Dead Status / Doors & Windows / Motion panels, device temps as "room" temps, 6 kW forecast spike in Power, 80 MWh axis in Energy, 248-tile Switches wall, crushed battery row, layout hole: ![before](https://gitea.renner.uno/attachments/c55aeaa0-e7ed-4fb9-83d4-e8b3abd0b466) ## After Top (all stats live, curated room temps, honest power, top energy flows): ![after](https://gitea.renner.uno/attachments/34754ba5-a909-4b68-ace7-ac5348db82ef) Bottom (curated door/motion tiles, lowest-12 batteries sorted and twin-free): ![after-bottom](https://gitea.renner.uno/attachments/bfafcbd2-9fc9-48c7-a7b3-c34469dc9ed5) ## Review report ### Critical 1. **"Home Assistant Status" showed No data.** Query used `up{job="homeassistant"}` but the scrape job is named `home-assistant` (with hyphen). ✅ FIXED — corrected job label; verified against live Prometheus (exactly one series, the proxy `:8124` target, post duplicate-scrape fix). 2. **"Doors & Windows" showed No data.** Query filtered on `device_class=~"door|window|opening"`, but the HA Prometheus exporter emits no `device_class` label at all (only `entity`, `friendly_name`, `domain`). ✅ FIXED — curated entity list built from HA's own device_class registry (via template API): exactly one canonical is-open entity per physical contact (22 sensors). The HmIP contacts export 12+ entities per device (`*_open`, `*_window_door_is_open`, `*_is_open_2`, `*_is_closed`, tilt, intrusion, …) — only the canonical `*_open` entity is used, so no inverted semantics and no `_2` twins. Appliance contacts (fridge door, Wickelschublade) deliberately excluded. 3. **"Motion Sensors" showed No data.** Same missing-label cause (`device_class="motion"`). ✅ FIXED — curated regex over the physical Bewegungsmelder/Präsenzmelder (including the `bewegunsmelder` typo entity), excluding per-zone twins (`*_zone_N_occupancy`) and synthetic `magic_areas_*` entities. 10 sensors currently report. ### Major 4. **"Temperature Sensors" mixed room temps with device electronics temps.** All 61 temperature series were plotted: fridge (5 °C), PoE switches (59–75 °C), Shelly relay internals (56–76 °C), Zigbee coordinator chips, NAS drives, heat-pump internals — drowning the ~9 real room sensors. ✅ FIXED — panel is now "Room & Outdoor Temperatures" with a curated include list (verified sensor by sensor): DG Büro desk + wall display, EG Schlafzimmer/Diele Luftqualität, EG Treppenhaus, KG Waschküche/Vorratskeller/KG Schlafzimmer, plus Außentemperatur (Vitocal outdoor sensor). The three dead EG Shelly H&T sensors (`eg_bad_shellyht`, `eg_schlafzimmer_shelly_h_t`, `eg_wohnzimmer_shellyht` — dead batteries) are included in the regex so they reappear automatically once revived. 5. **"Power Consumption" plotted non-consumption series.** The 6 kW "spike" in the before shot is `Vitocharge battery max charge power` — a constant capability value, not a measurement. Solcast peak *forecasts* (5.2/4.4 kW) and `power_production_next_12hours` were also drawn as if real draw. ✅ FIXED — excluded forecast/capability/derived series (`solcast_*`, `power_production_*`, `*_max_(charge|discharge)_power`, `erlaubte_*`, `hauslast_nacht*`). Top series are now real measurements (battery ~955 W, Gesamtverbrauch ~953 W, inverter AC ~846 W — verified live). 6. **"Energy Usage (kWh)" plotted raw lifetime counters.** Axis ran to 80 MWh because multi-year cumulative counters were mixed with small daily sensors — the panel conveyed nothing. ✅ FIXED — replaced with "Top Energy Flows (24h)": bargauge of `topk(12, max by (entity, friendly_name) (increase(...[24h])))`, forecast counters excluded (`solcast_*`, forecast.solar's `energy_production_*` / `energy_current_hour` / `energy_next_hour`). The `max by` also dedupes duplicate-scrape residue still inside the 24 h lookback (observed pairs like 4310.2/4309.0 during verification; self-heals, dedup keeps it honest meanwhile). Current output: Solar Produktion Tag 26 kWh, grid export 11 kWh, Keller 10.1 kWh, DHW thermal 7.1 kWh — all plausible. 7. **"Switches" was a wall of 248 unreadable micro-tiles.** ✅ FIXED — replaced by a "Switches On" count stat in the top row (currently 118 of 248). A per-switch view is unusable at this cardinality and most entries are config/diagnostic switches. 8. **"Battery Levels" crammed 119 bars into one 4-unit row, with battery_notes twins.** Every device appeared twice (`*_battery` + `*_battery_plus`), pairs like 1 %/1 %. ✅ FIXED — now "Lowest Batteries": `bottomk(12, ...)` excluding `*battery_plus*` twins, instant query, double height. Renders 1 % → 56.5 % sorted, twin-free. ### Minor 9. **Entity-count stats could double-count under scrape faults.** ✅ FIXED — both counts wrapped in `count(max by (entity) (...))`; all stat panels switched to `instant: true` so a dead exporter shows No data instead of a stale last value. 10. **"Unavailable Entities" thresholds were meaningless.** Yellow at ≥1, red at ≥5 — but the structural baseline is ~1139 unavailable of 4034 (cross-checked against the HA API: 1138 unavailable/unknown at review time — disabled integrations, dead sensors, `_2` twins). The panel was permanently red while nothing was wrong. ✅ FIXED — neutral blue display; it is an informational count, not an alert. 11. **Ragged layout.** The 3-stat top row spanned only half the width, so Grafana float-packed the right column up 4 rows, leaving a hole next to "Motion Sensors". ✅ FIXED — clean 4-stat top row (Status, Total, Unavailable, Switches On), aligned 2×2 chart grid, full-width battery row. ## Hardware findings (plain, not papered over) - ⚠️ **5 motion sensors are unavailable in HA right now**: `g5_dome_motion`, `g6_instant_motion` (UniFi cameras), `haustur_entry_motion`, `dg_treppenhaus_bewegungsmelder_motion`, `kg_werkstatt_prasenzmelder_occupancy`. They are in the panel regex and will appear when they come back — hardware/integration issue, not a dashboard one. - ⚠️ **`dg_buro_fenstersensor_sud_opening` (DG Büro south window) is not reporting**; the other 21 curated contacts are live. - ⚠️ **DG Büro Meter Pro** (SwitchBot, known offline) currently has no temperature entity in HA at all, so it could not be added to the temperature list without guessing an entity id. Can be appended once it returns. ## Open questions - ❓ **Obergeschoss** has no room temperature sensor (expected per your earlier confirmation), so the temperature panel has no OG series. Fine as-is, or do you want an explicit "Kein Sensor installiert" placeholder like on home-overview? - ❓ **"Power Consumption"** still plots ~170 individual series (honest data now, but an unwieldy legend). Keep, or cut down to house total + PV + battery + top consumers? I'll push either variant. ## Verification Every query was verified against live Prometheus (instant queries via port-forward) and the HA REST/template API before being written: - `up{job="home-assistant"}` → 1 series, value 1; `job="homeassistant"` → empty (root cause #1). - `homeassistant_binary_sensor_state` label set contains no `device_class` (root cause #2/#3); curated lists derived from HA's device_class registry via the template API. - Entity counts: raw `count(...)` == deduped `count(max by (entity)(...))` == 4034 (no active double-count); unavailable 1139 vs HA API 1138 ✓. - Curated doors list: 21/22 live; motion list: 10 live (5 unavailable, listed above); typo entity `eg_eingang_bewegunsmelder_occupancy` confirmed matched by `bewegun.?smelder`. - Power/energy exclusions: confirmed the surviving top series are genuine measurements (values quoted above); confirmed `battery_max_charge_power`, Solcast peaks and `PV Vorhersage` counters are gone. - Battery `bottomk` output verified twin-free and ascending. - JSON validated (`json.load`); modified dashboard rendered via temp preview uid `homeassistant-overview-preview` (deleted after the after-shots).
claude-bot added 1 commit 2026-07-16 22:36:15 +00:00
- Status panel: job label is home-assistant (hyphen), was homeassistant -> No data
- Doors & Windows / Motion: exporter has no device_class label; select curated
  entity lists instead (one canonical is-open entity per physical contact,
  physical motion/presence sensors without zone/magic_areas duplicates)
- Temperature: was all 61 temp series incl. device-internal electronics temps
  (fridge 5C, PoE switch 75C, Shelly 58-75C); curated to room/ambient sensors
  + outdoor temp, incl. currently-dead EG H&T sensors so they reappear
- Power Consumption: exclude non-consumption series (Solcast forecasts,
  battery max charge/discharge capability, derived night-load stats)
- Energy: cumulative lifetime counters (up to 80 MWh) told nothing; now
  bargauge of top 12 increase() over 24h, forecast counters excluded,
  max by () dedup against scrape residue
- Switches: 248 unreadable micro-tiles -> single 'Switches On' count stat
- Battery: bottomk(12) instant, battery_notes *_battery_plus twins excluded
- Entity counts: max by (entity) dedup, instant queries on all stats
- Unavailable Entities: neutral blue; ~1139 is the structural baseline
  (verified against HA API), old yellow>=1/red>=5 thresholds were meaningless

Co-Authored-By: Claude Opus 4.8 <noreply@anthropic.com>
k.renner merged commit 8e2c569bb0 into master 2026-07-17 10:59:09 +00:00
Sign in to join this conversation.